
OVERVIEW
VOLUME AND UNITS DOWN, WITH AVERAGE SALE PRICES UP FROM A YEAR AGO.
ANNUAL SALES VOLUME OF $1,610,600,893
Down 31% from 2021’s record $2,329,316.780, with units of 1648 down 38% from 2021’s 2646. New listings of 3738 up 10% from one year ago, with the sales/listings ratio of 44% down 34%.
FOURTH-QUARTER SALES VOLUME OF $282,507,516
Down 44% from Q4-2021’s $500,077,953. Units of 307 down 41% from Q4-2021’s 520, with a 47% sales/listings ratio. New listings of 652 up 14% from a year ago, with expireds of 283 up 225%.
RECORD ANNUAL AVERAGE SALE PRICE OF $977,306
Up 11% from last year’s $880,316. Annual average days-on-market of 27 up 6 days
THE DEMAND FOR LISTINGS IS EQUAL TO THE SUPPLY
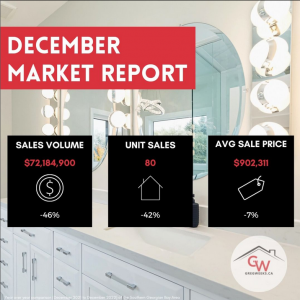
The Southern Georgian Bay market had a 95.1% sale/list price ratio in December. Homes sold in 55 days on average, up 32 days from a year ago, and there is currently 6 months of inventory. All that said, December saw 80 sales on just 108 new listings. Overall, it is a balanced market.
CLICK BELOW FOR FULL REPORTS:
2022 In Review – Southern Georgian Bay Market Report
2022 In Review – Southern Georgian Bay Market Snapshot

