

Online Easter Egg Hunt 2026!
Your favourite online contest is back for another year! Once again, it will all be done virtually and your job is to count the number of eggs you see in
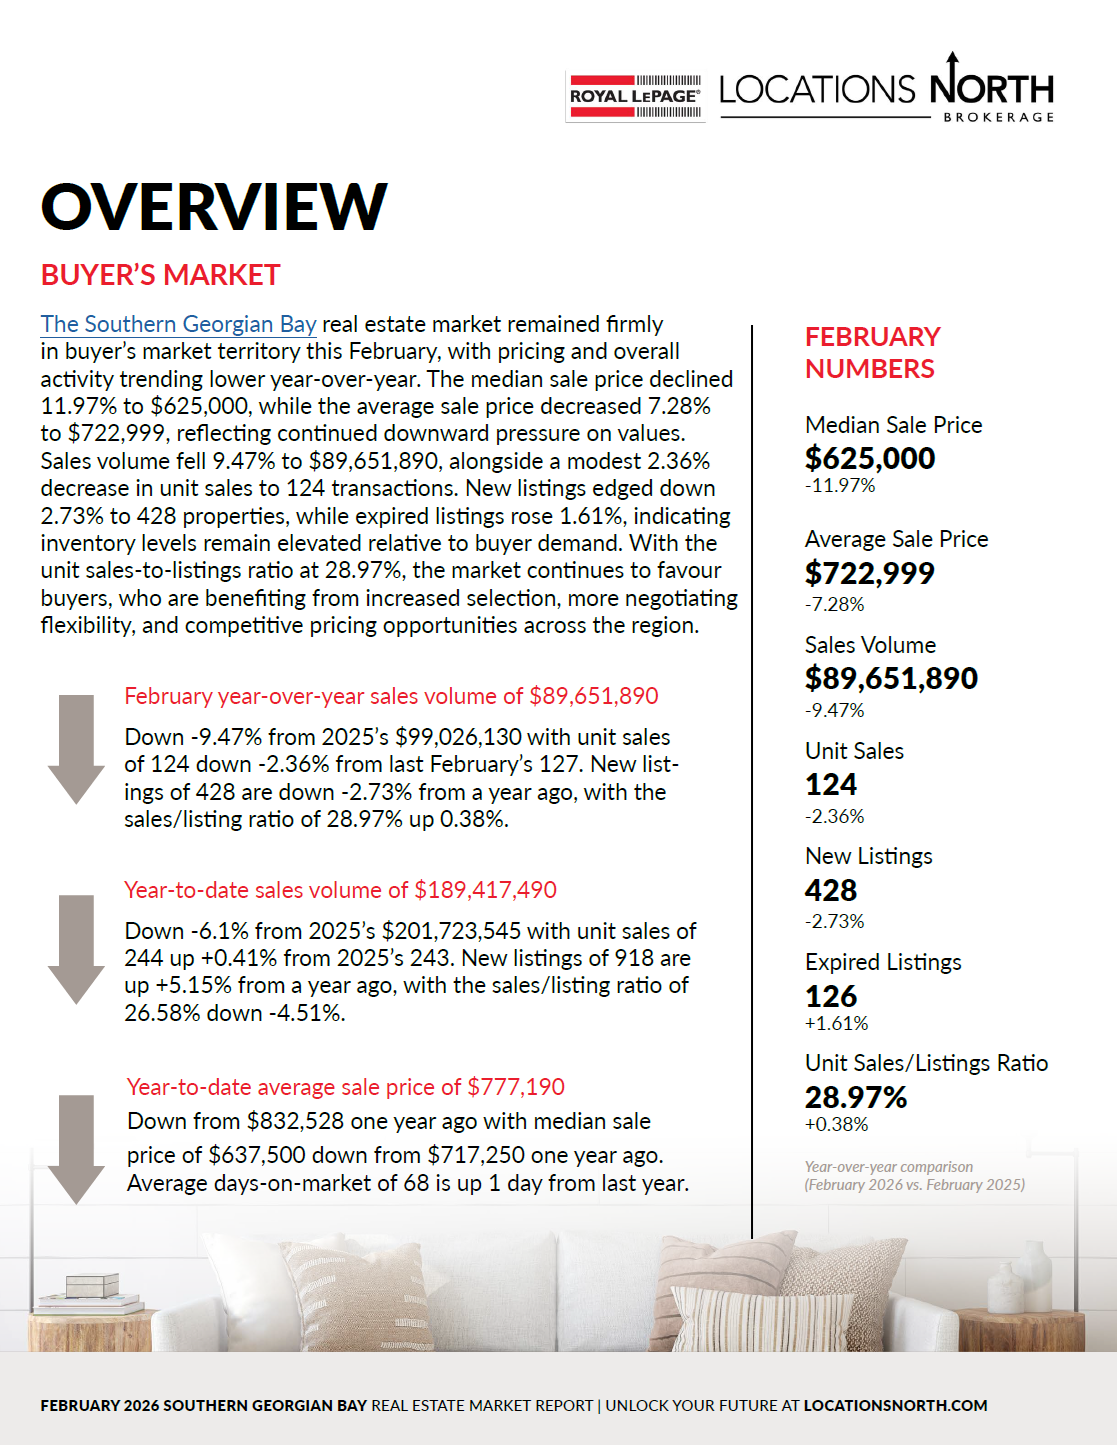
February 2026 Market Stats for Blue Mountains, Clearview, Collingwood, Grey Highlands, Meaford, Tiny, Wasaga Beach
The Southern Georgian Bay real estate market continues to favour buyers to start 2026, with both unit sales and sales volume showing an increase compared to last year. Meanwhile, the
2025 Market Stats for Blue Mountains, Clearview, Collingwood, Grey Highlands, Meaford, Tiny, Wasaga Beach
The Southern Georgian Bay real estate market continued to favour buyers this December, with modest price softening and steady sales activity shaping overall conditions. The median sale price edged down
2025 Market Stats for Blue Mountains, Clearview, Collingwood, Grey Highlands, Meaford, Tiny, Wasaga Beach
The Southern Georgian Bay real estate market continues to favour buyers this month, with both unit sales and sales volume showing an increase compared to last year. Meanwhile, the median
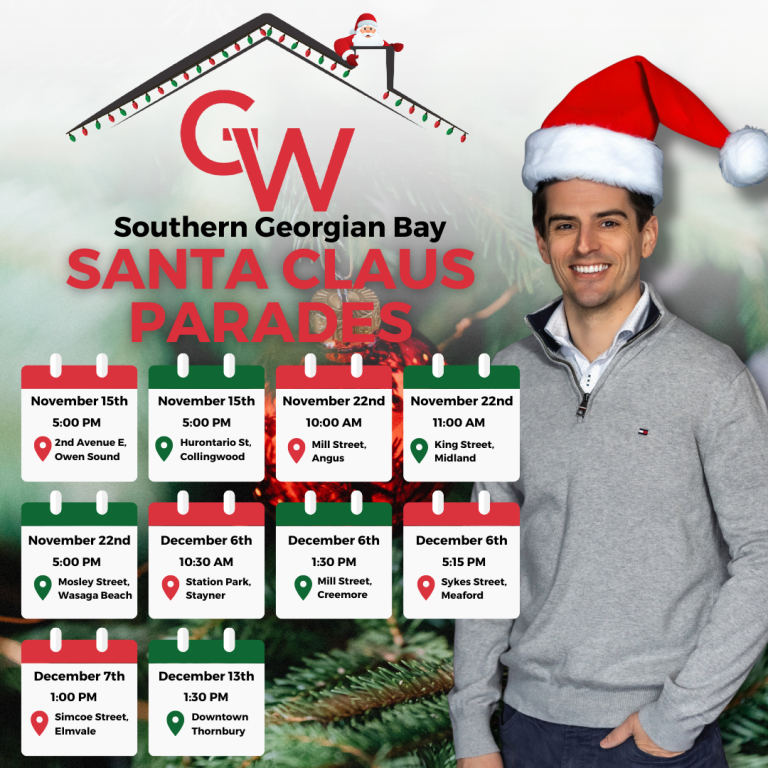
Santa Claus is Coming to Town – Southern Georgian Bay Holiday Parade Guide 2025
The holiday season is upon us, and Santa is making his way through the Southern Georgian Bay area once again. Each community has its own unique way of celebrating, and

Win a Collingwood Blues Jersey!
All you have to do to enter is submit your name, email and size of jersey in the message box (for if you win). The contest opens September 1st, 2025

Online Easter Egg Hunt 2025!
Hi everyone and thanks for taking part in my 2025 Easter Egg hunt! Once again, it will all be done virtually and your job is to count the number of
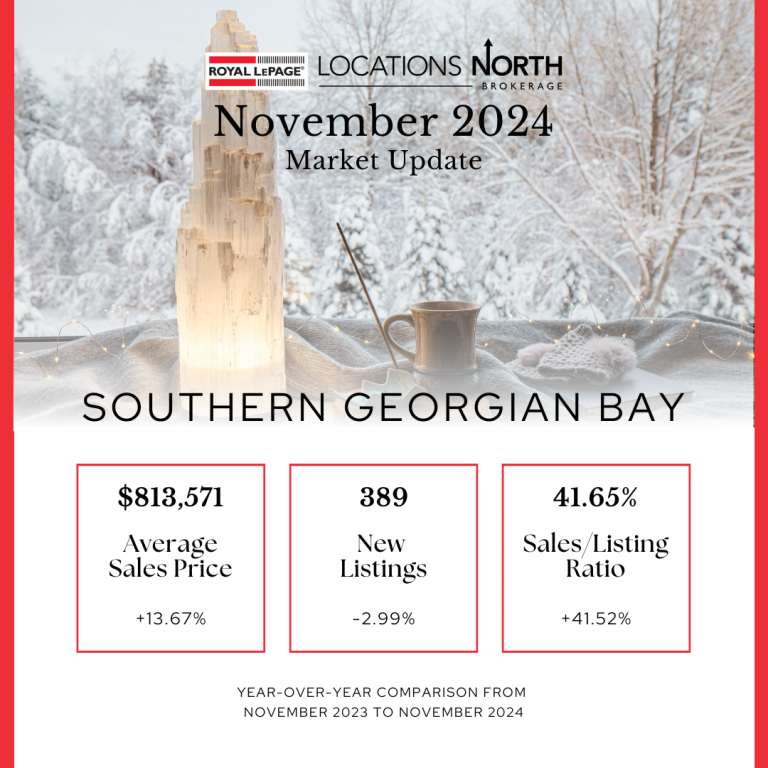
November 2024 Market Stats for Blue Mountains, Clearview, Collingwood, Grey Highlands, Meaford, Tiny, Wasaga Beach
The Southern Georgian Bay real estate market continues to favour buyers this month, with both unit sales and sales volume showing an increase compared to last year. Meanwhile, the median
Southern Georgian Bay 2024 Santa Claus Parades: Your Guide to Holiday Cheer!
The holiday season is upon us, and the communities of Southern Georgian Bay are gearing up for their annual Santa Claus parades. These festive events are a cherished tradition, bringing

October 2024 Market Stats for Blue Mountains, Clearview, Collingwood, Grey Highlands, Meaford, Tiny, Wasaga Beach
The Southern Georgian Bay real estate market continues to favour buyers this month, BUT we did see a slight increase in Sales Volume for the second month in a row.
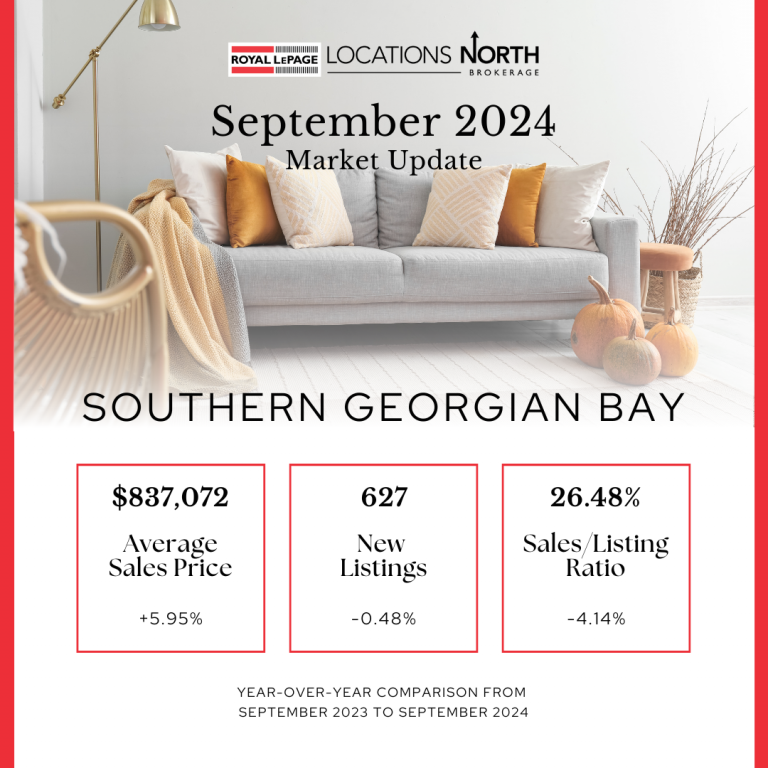
September 2024 Market Stats for Blue Mountains, Clearview, Collingwood, Grey Highlands, Meaford, Tiny, Wasaga Beach
The Southern Georgian Bay real estate market continues to favour buyers this month, BUT we did see a slight increase in Sales Volume. The median and average sale prices have
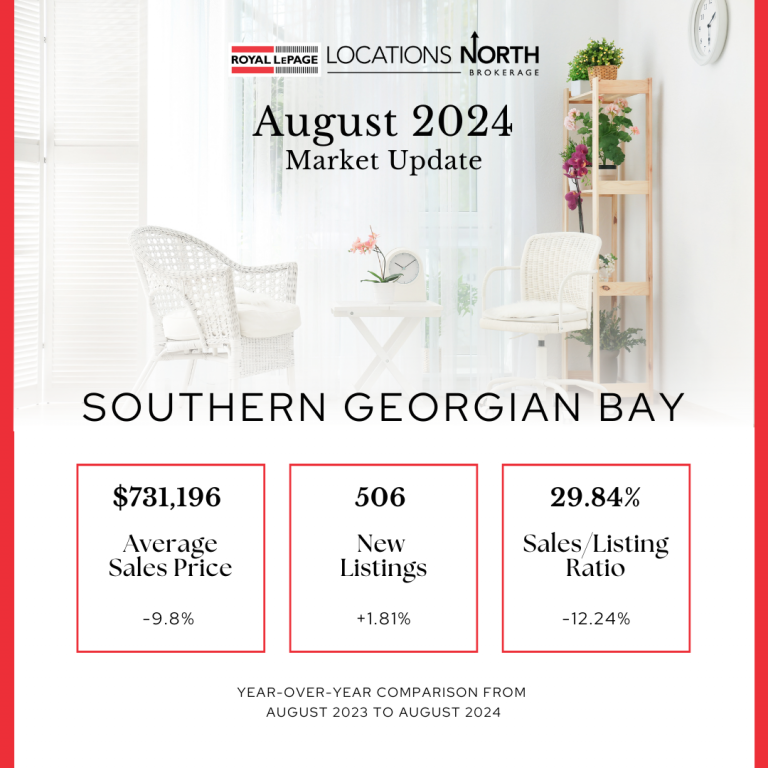
August 2024 Market Stats for Blue Mountains, Clearview, Collingwood, Grey Highlands, Meaford, Tiny, Wasaga Beach
The Southern Georgian Bay real estate market still favors buyers this month, with both unit sales and sales volume having decreased compared to last year. The median and average sale
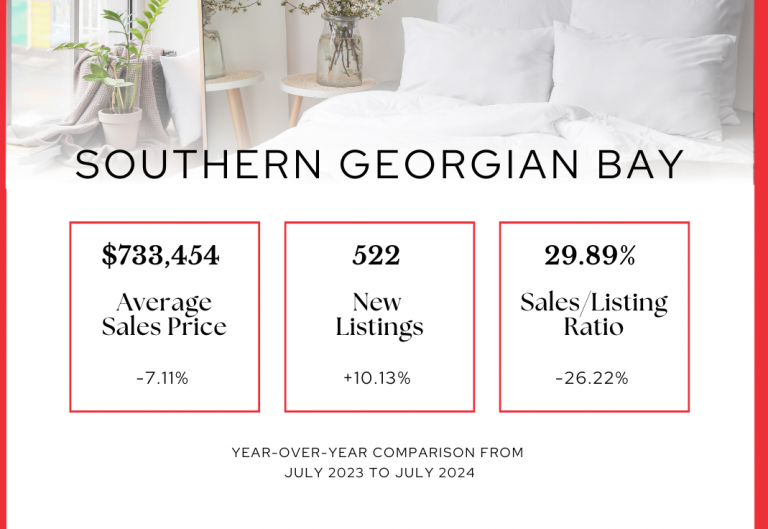
July 2024 Market Stats for Blue Mountains, Clearview, Collingwood, Grey Highlands, Meaford, Tiny, Wasaga Beach
The Southern Georgian Bay real estate market still favors buyers this month, with both unit sales and sales volume having decreased compared to last year. The median and average sale
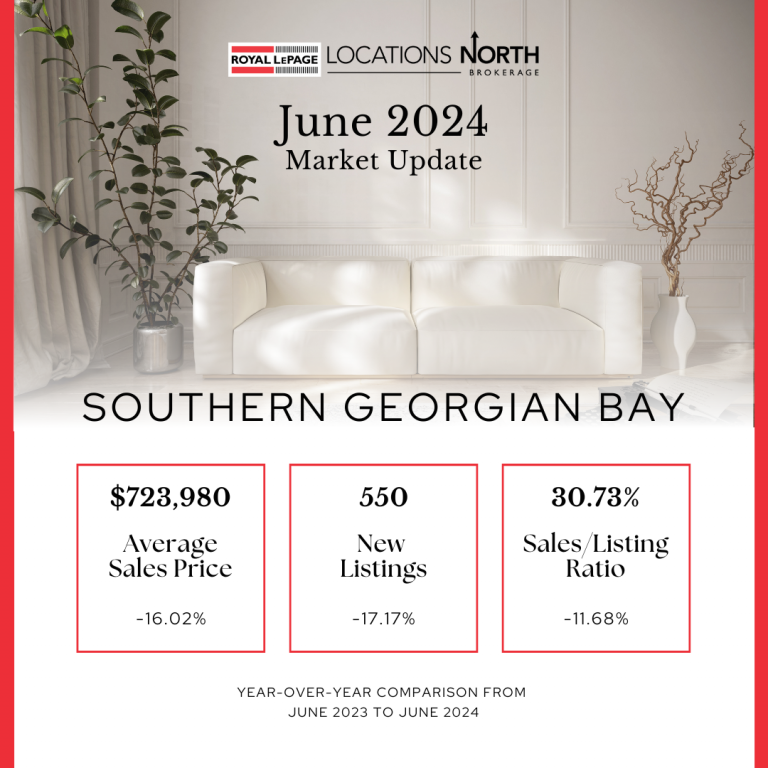
June 2024 Market Stats for Blue Mountains, Clearview, Collingwood, Grey Highlands, Meaford, Tiny, Wasaga Beach
Below you will find a full JUNE 2024 Market Report and Market Snapshot broken down by town (Blue Mountains, Clearview, Collingwood, Grey Highlands, Meaford, Tiny, Wasaga Beach). Any questions, contact
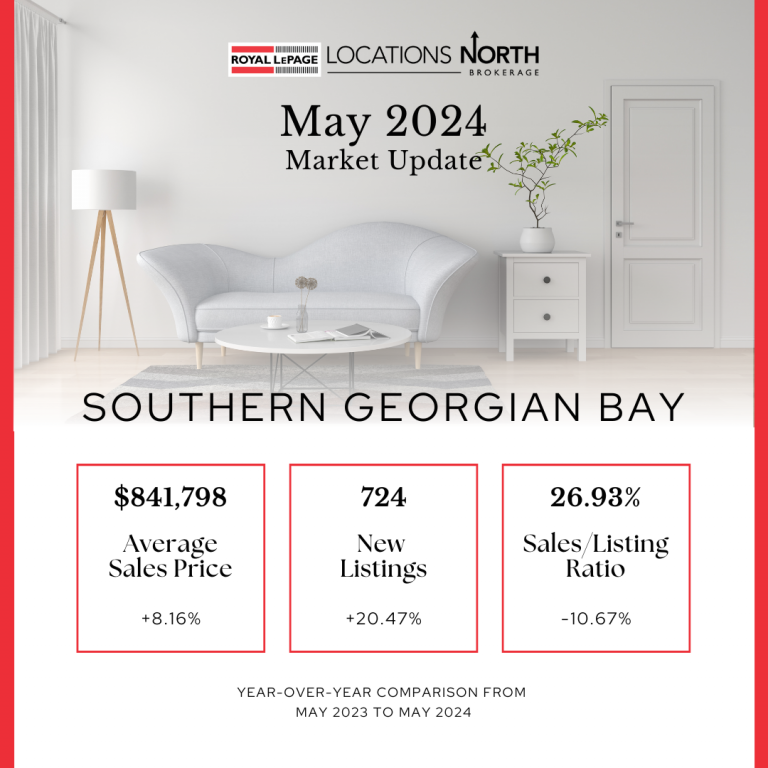
May 2024 Market Stats for Blue Mountains, Clearview, Collingwood, Grey Highlands, Meaford, Tiny, Wasaga Beach
Below you will find a full May 2024 Market Report and Market Snapshot broken down by town (Blue Mountains, Clearview, Collingwood, Grey Highlands, Meaford, Tiny, Wasaga Beach). Any questions, contact
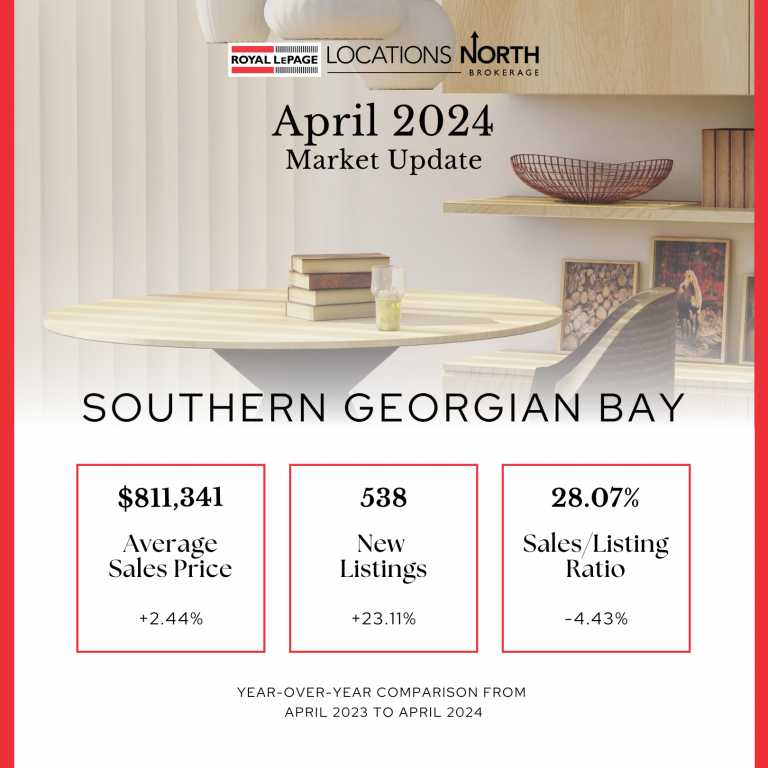
April 2024 Market Stats for Blue Mountains, Clearview, Collingwood, Grey Highlands, Meaford, Tiny, Wasaga Beach
Below you will find a full April 2024 Market Report and Market Snapshot broken down by town (Blue Mountains, Clearview, Collingwood, Grey Highlands, Meaford, Tiny, Wasaga Beach). Any questions, contact
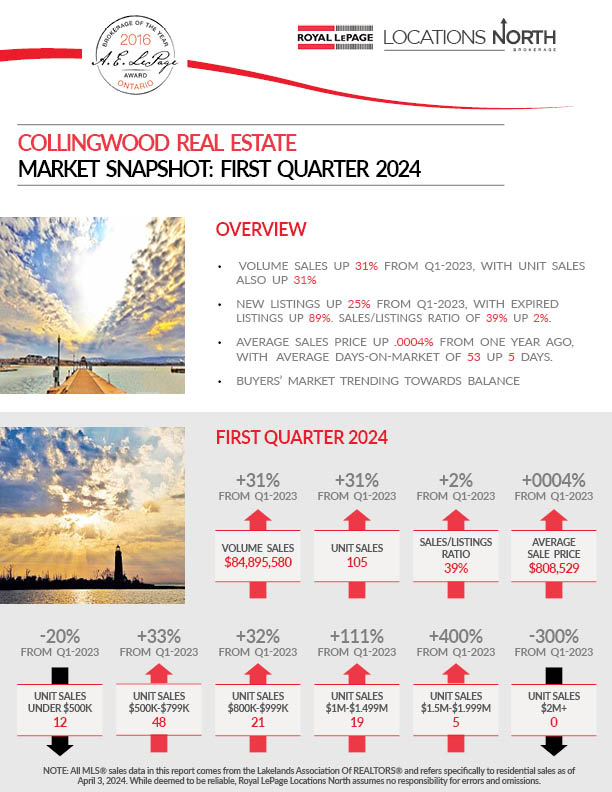
First Quarter 2024 Market Stats for Blue Mountains, Clearview, Collingwood, Meaford, Wasaga Beach
Below you will find a full Q1 2024 Market Report and Market Snapshot broken down by town (Blue Mountains, Clearview, Collingwood, Meaford, Wasaga Beach). Any questions, contact me directly. BLUE

March 2024 Southern Georgian Bay Market Report (First Quarter)
OVERVIEW YEAR-TO-DATE VOLUME, UNITS AND AVERAGE PRICES UP FROM A YEAR AGO FIRST QUARTER SALES VOLUME OF $283,940,284 Up 11% from Q1-2023, with units of 332 also up 11% from

Easter Egg Hunt 2024!
Hi everyone and thanks for taking part in my 2024 Easter Egg hunt! Once again, it will all be done virtually and your job is to count the number of

February 2024 Southern Georgian Bay Market Report
OVERVIEW YEAR-TO-DATE VOLUME AND UNIT SALES UP, WITH AVERAGE SALE PRICES DOWN YEAR-TO-DATE SALES VOLUME OF $167,886,105 Up 7% from 2023’s $156,359,400, with units of 206 up 18% from 2023’s
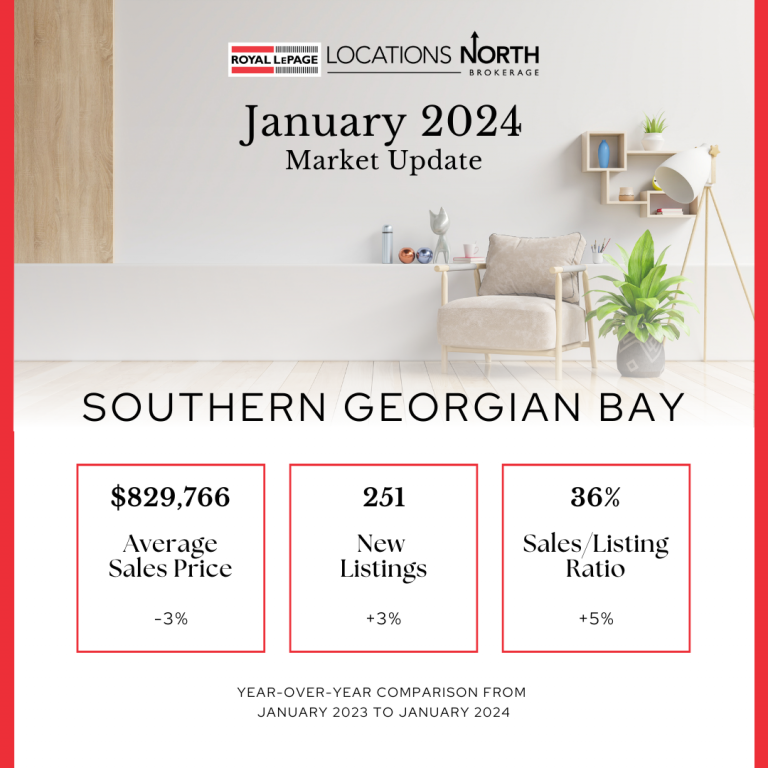
January 2024 Southern Georgian Bay Market Report
OVERVIEW SALES UP FROM LAST JANUARY, WITH AVERAGE PRICES DOWN. JANUARY VOLUME OF $74,678,900 Up 15% from 2023’s $64,893,600, with units of 90 up 18% from last year’s 76. New
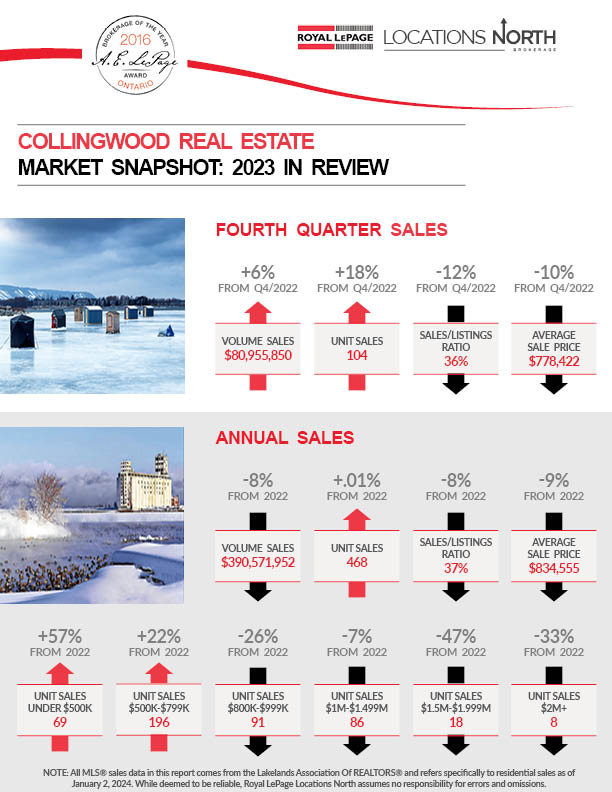
2023 Year in Review Market Stats for Collingwood, Clearview, Grey Highlands, Meaford, The Blue Mountains and Wasaga Beach
Below you will find a full 2023 Year in Review Market Report and Market Snapshot broken down by town (Blue Mountains, Clearview, Collingwood, Grey Highlands, Meaford, Wasaga Beach). Any questions,

2023 Year in Review – Southern Georgian Bay Market Report
OVERVIEW VOLUME AND UNITS DOWN, WITH AVERAGE SALE PRICES ALSO DOWN AND LISTINGS UP ANNUAL SALES VOLUME OF $1,371,549,822 Down 15% from 2022’s $1,610,600,893, with units of 1592 down 3%from

Collingwood Blues Night With Champions Photos
Thanks to One Shot Photography for capturing the fun night. https://www.facebook.com/oneshotphotographycollingwood/