
OVERVIEW
YEAR-TO-DATE VOLUME, UNITS AND AVERAGE PRICES UP FROM A YEAR AGO
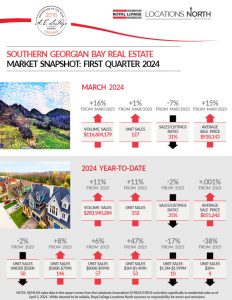
FIRST QUARTER SALES VOLUME OF $283,940,284
Up 11% from Q1-2023, with units of 332 also up 11% from last year’s 301. New listings of 962 up 18% from one year ago, with the sales/listings ratio of 35% down 2%.
MARCH SALES VOLUME OF $116,604,179
Up 16% from last year’s $100,808,404. March units of 127 up 1% from last year’s 126. New listings of 405 up 21% from a year ago, with the sales/listing ratio of 31% down 7%.
YEAR-TO-DATE AVERAGE SALE PRICE OF $855,242
Up .001% from last year’s $854,243. Average days-on-market of 38 down 16 from a year ago.
THE DEMAND FOR LISTINGS IS SLIGHTLY GREATER THAN THE SUPPLY
The Southern Georgian Bay market had a 97.3% sale/list price ratio in March, up from last March’s 96.7%. Homes sold in 57 days on average, up 16 days from a year ago. There is currently 5 months of inventory. All that, and March’s 31% sales/listings ratio, adds up to a buyers’ market which seems to be transitioning towards balance.
Q1-2024 – Southern Georgian Bay Market Report
Q1-2024 – Southern Georgian Bay Market Snapshot

