

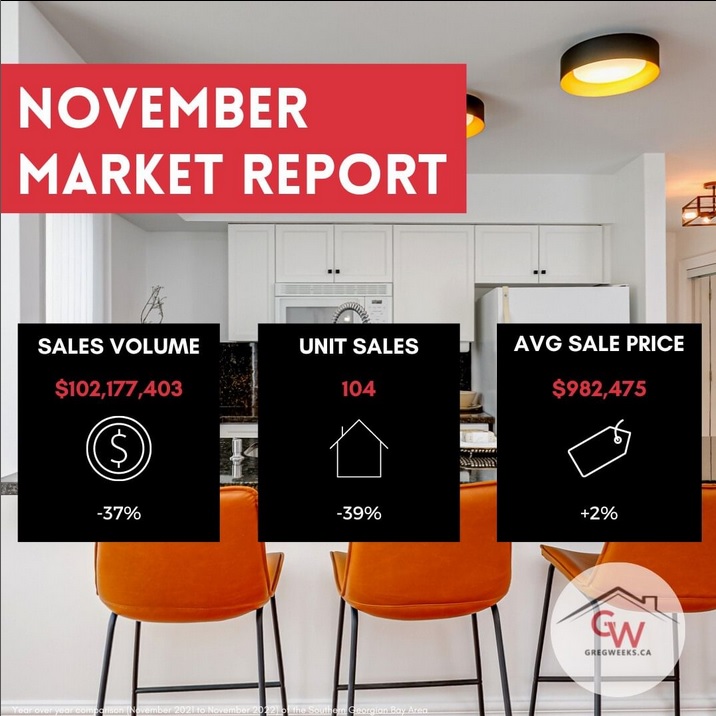
November 2023 Southern Georgian Bay Market Report
OVERVIEW VOLUME AND UNIT SALES DOWN WITH AVERAGE SALE PRICE ALSO DOWN YEAR-TO-DATE SALES VOLUME OF $1,326,459,922 Down 14%from 2022’s $1,536,203,993, with units of 1530 down 2%from 2022’s 1566. New
Southern Georgian Bay 2023 Santa Claus Parades Schedule!
Are you wondering where and when the local Santa Claus Parades are happening in your area? Check out this blog below for all of the information, including times & parade

October 2023 Southern Georgian Bay Market Report
OVERVIEW VOLUME AND UNIT SALES DOWN, WITH AVERAGE SALE PRICE ALSO DOWN YEAR-TO-DATE SALES VOLUME OF $1,246,034,072 Down 13% from 2022’s $1,435,803,590, with units of 1429 down 2% from 2022’s

Halloween in Collingwood 2023!
Halloween in Collingwood is here! 🎃 Here are a few great family events to get you in the spooky spirit ahead of the big day on Tuesday! 👻 This Friday
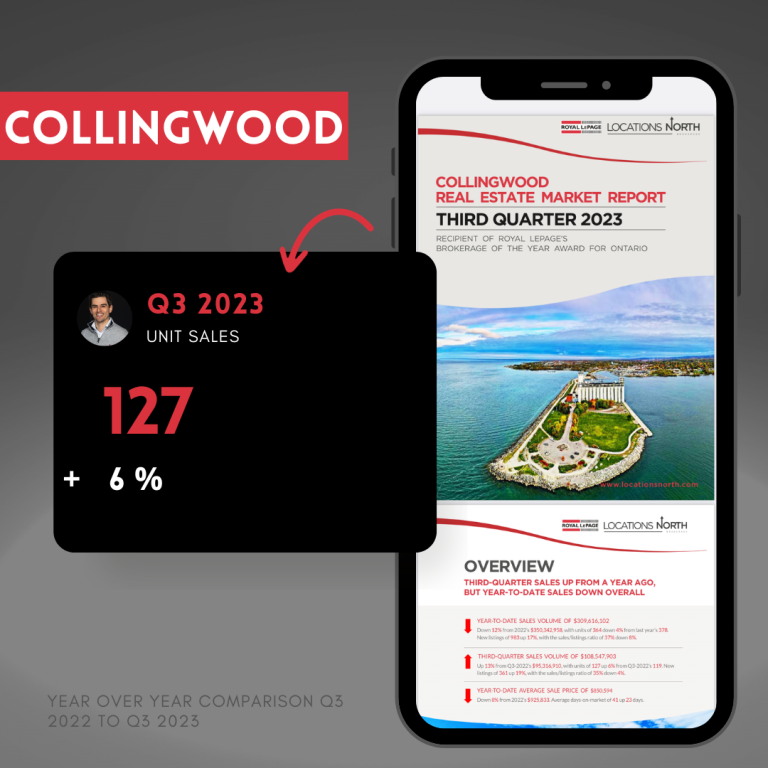
Q3 2023 Market Stats for Collingwood, Clearview, Grey Highlands, Meaford, The Blue Mountains and Wasaga Beach
Below you will find a full 2023 Third Quarter (Q3) Market Report and Market Snapshot broken down by town (Blue Mountains, Clearview, Collingwood, Grey Highlands, Meaford, Wasaga Beach). Any questions,
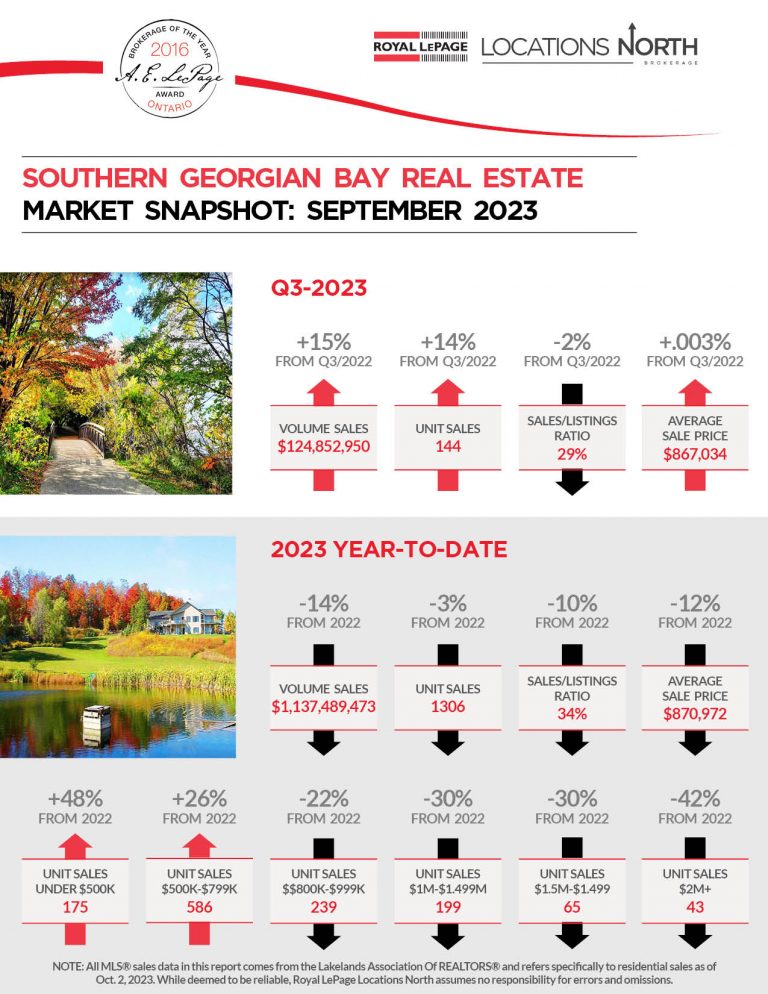
September 2023 Southern Georgian Bay Market Report
OVERVIEW THIRD-QUARTER SALES UP FROM A YEAR AGO, BUT YEAR-TO-DATE SALES DOWN OVERALL YEAR-TO-DATE SALES VOLUME OF $1,137,489,473 Down 14% from 2022’s $1,328,093,377, with units of 1306 down 3% from
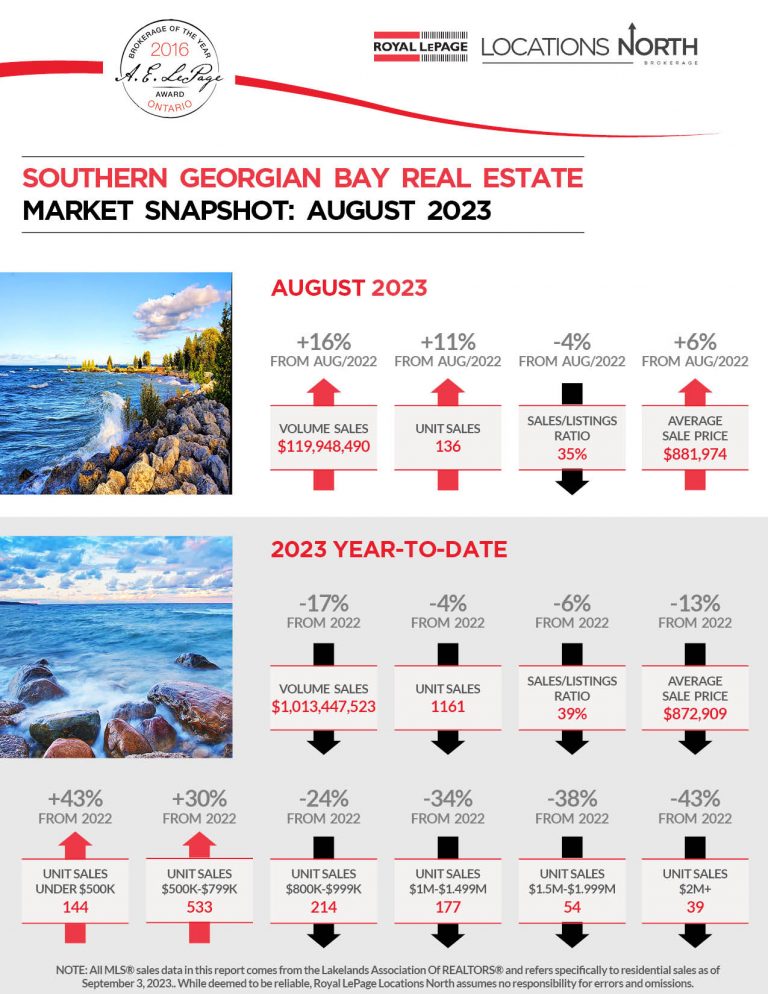
August 2023 Southern Georgian Bay Market Report
VOLUME AND UNIT SALES UP FROM LAST AUGUST, BUT WITH AVERAGE SALE PRICES DOWN YEAR-TO-DATE SALES VOLUME OF $1,013,447,523 Down 17% from 2022’s $1,219,188.468, with units of 1161 down 4%

July 2023 Southern Georgian Bay Market Report
SOUTHERN GEORGIAN BAY REAL ESTATE MARKET REPORT – JULY 2023 OVERVIEW: JULY VOLUME AND UNITS UP, WITH YEAR-TO-DATE VOLUME AND UNITS DOWN YEAR-TO-DATE SALES VOLUME OF $892,997,033 Down 20% from

Boat launches in Southern Georgian Bay
The Southern Georgian Bay area is a haven for boating enthusiasts. If you’re planning on exploring the bay, having access to a boat launch is essential! Take a peek at
 *******************************************@*******ks.realtor-•-Instagram-photos-and-videos-768x768.png" class="attachment-medium_large size-medium_large wp-image-15660" alt="Beaches in Southern Georgian Bay" srcset="https://gregweeks.ca/wp-content/uploads/sites/326/2023/07/Sc*******************************************@*******ks.realtor-•-Instagram-photos-and-videos-768x768.png 768w, https://gregweeks.ca/wp-content/uploads/sites/326/2023/07/Sc*******************************************@*******ks.realtor-•-Instagram-photos-and-videos-300x300.png 300w, https://gregweeks.ca/wp-content/uploads/sites/326/2023/07/Sc*******************************************@*******ks.realtor-•-Instagram-photos-and-videos-150x150.png 150w, https://gregweeks.ca/wp-content/uploads/sites/326/2023/07/Sc*******************************************@*******ks.realtor-•-Instagram-photos-and-videos-600x600.png 600w, https://gregweeks.ca/wp-content/uploads/sites/326/2023/07/Sc*******************************************@*******ks.realtor-•-Instagram-photos-and-videos.png 818w" sizes="(max-width: 768px) 100vw, 768px" />
Beaches in Southern Georgian Bay
Southern Georgian Bay is full of incredible beaches and picturesque views. Here are some of my favourite beaches in the area, highlighting their unique amenities and natural features that make
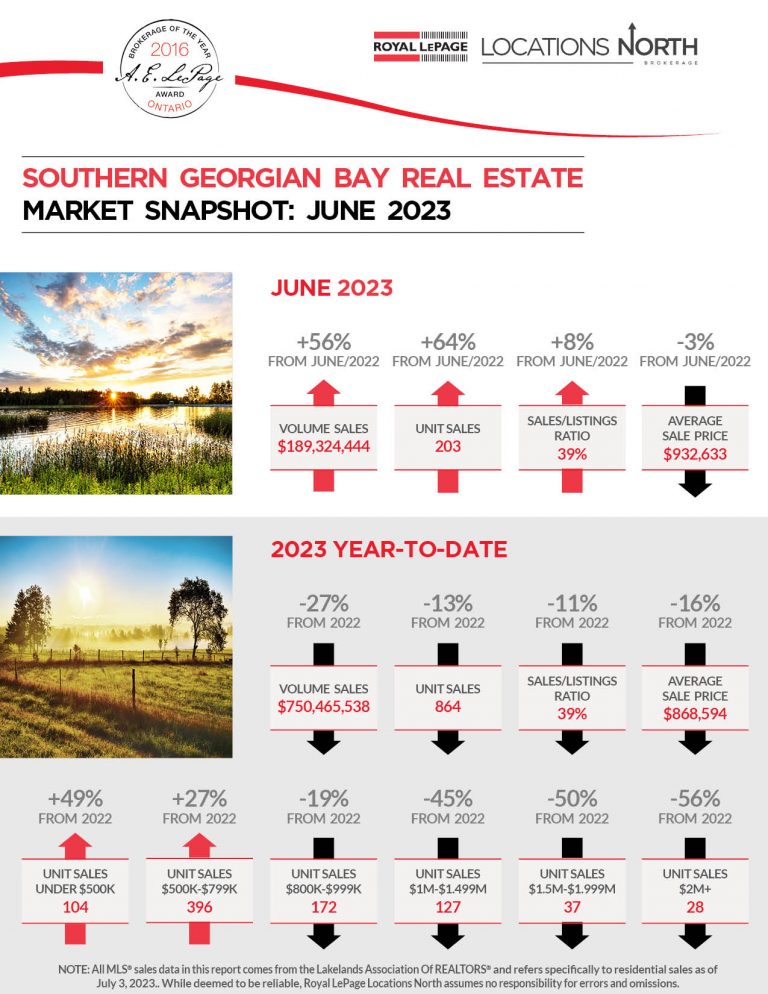
Southern Georgian Bay 2nd Quarter Market Update 2023
OVERVIEW YEAR-TO-DATE SALES DOWN FROM 2022, BUT WITH SECOND QUARTER AND JUNE SALES UP YEAR-TO-DATE SALES VOLUME OF $750,465,538 Down 27% from 2022’s $1,030,314,845, with units of 864 down 13%
Canada Day Southern Georgian Bay 2023
Looking for some great ways to celebrate the first long weekend of the summer in Southern Georgian Bay? Luckily for you, there are a variety of events going on along

May 2023 Southern Georgian Bay Market Report
OVERVIEW VOLUME AND UNITS UP FROM MAY 2022, WITH AVERAGE SALE PRICES DOWN. YEAR-TO-DATE SALES VOLUME OF $561,539,094 Down 38% from 2022’s $911,553,419, with units of 661 down 24% from
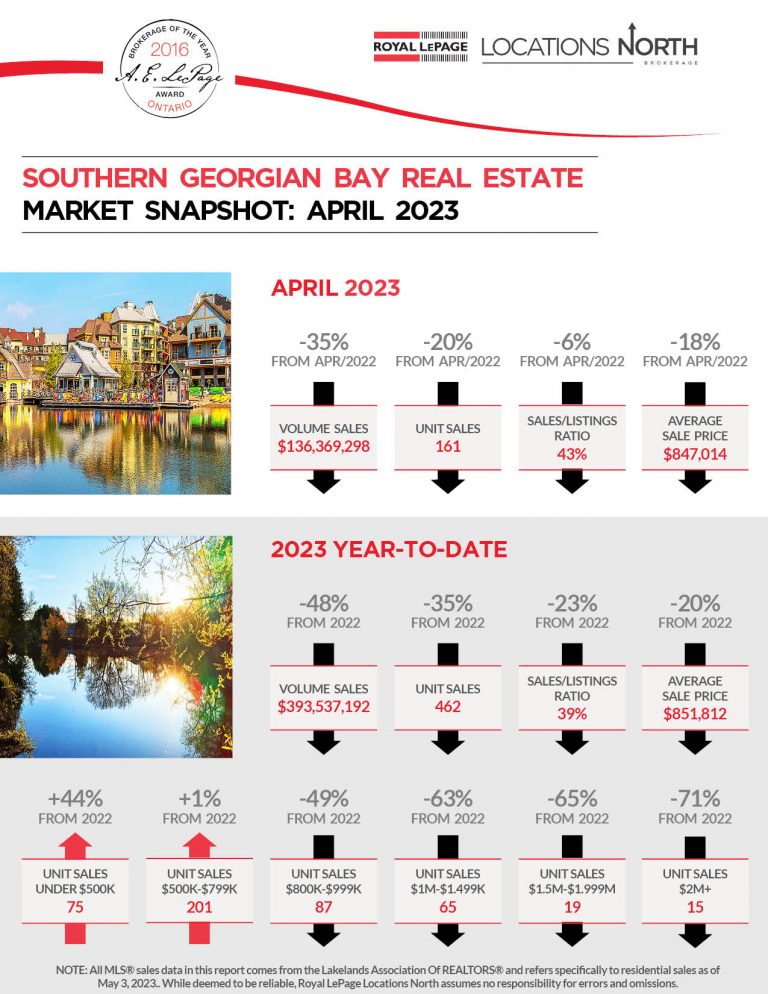
April 2023 Southern Georgian Bay Market Report
OVERVIEW APRIL VOLUME AND UNIT SALES THE MOST SINCE LAST MAY. YEAR-TO-DATE SALES VOLUME OF $393,537,102 Down 48% from 2022’s $752,743,842, with units of 462 down 35% from 2022’s 706.
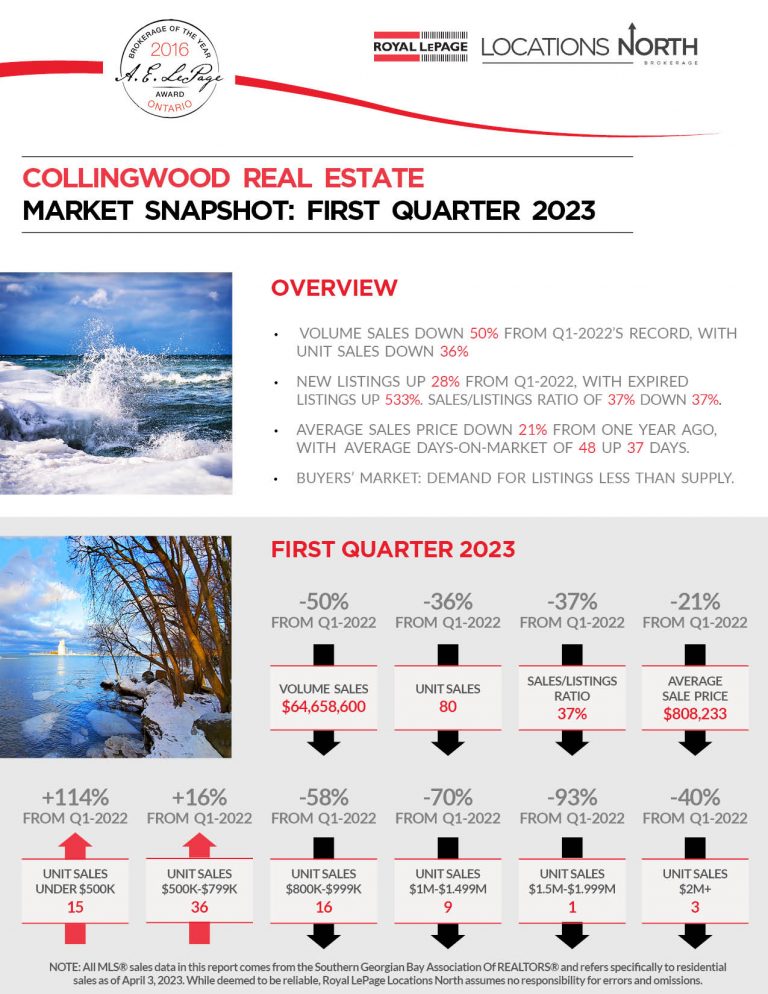
Q1 2023 Market Stats by area in Southern Georgian Bay
Below you will find a full 2023 First Quarter (Q1) Market Report and Market Snapshot broken down by town (Blue Mountains, Clearview, Collingwood, Grey Highlands, Meaford, Wasaga Beach). Any
2023 Easter Eggs Found!
So which eggs did you miss? Congrats to this years winner and hope to see you all again next year!
First Quarter 2023 Market Stats – Southern Georgian Bay
OVERVIEW VOLUME, UNITS AND PRICES DOWN FROM LAST YEAR, WITH AVERAGE SALE TIMES UP FIRST-QUARTER SALES VOLUME OF $255,882,804 Down 54% from Q1-2022’s $543,195,714, with units of 300 down 41%

2022 Market Reports by Town
Below you will find a full 2022 Market Report and 2022 Market Snapshot broken down by town (Blue Mountains, Clearview, Collingwood, Grey Highlands, Meaford, Owen Sound, Wasaga Beach). Any questions,
 *******************************************@*******ks.realtor-•-Instagram-photos-and-videos.png" class="attachment-medium_large size-medium_large wp-image-15003" alt="" srcset="https://gregweeks.ca/wp-content/uploads/sites/326/2023/02/Sc*******************************************@*******ks.realtor-•-Instagram-photos-and-videos.png 716w, https://gregweeks.ca/wp-content/uploads/sites/326/2023/02/Sc*******************************************@*******ks.realtor-•-Instagram-photos-and-videos-300x300.png 300w, https://gregweeks.ca/wp-content/uploads/sites/326/2023/02/Sc*******************************************@*******ks.realtor-•-Instagram-photos-and-videos-150x150.png 150w, https://gregweeks.ca/wp-content/uploads/sites/326/2023/02/Sc*******************************************@*******ks.realtor-•-Instagram-photos-and-videos-600x600.png 600w" sizes="(max-width: 716px) 100vw, 716px" />
Southern Georgian Bay 2022 Year in Review Market Stats
OVERVIEW VOLUME AND UNITS DOWN, WITH AVERAGE SALE PRICES UP FROM A YEAR AGO. ANNUAL SALES VOLUME OF $1,610,600,893 Down 31% from 2021’s record $2,329,316.780, with units of 1648 down
November 2022 Southern Georgian Bay Market Stats
SOUTHERN GEORGIAN BAY REAL ESTATE MARKET REPORT NOVEMBER 2022 YEAR-TO-DATE SALES VOLUME OF $1,537,980,993 Down 30% from 2021’s $2,194,405,031, with units of 1567 down 37% from 2021’s 1567. New listings

Santa Claus Parades in Georgian Bay 2022
Are you wondering where and when the local Santa Claus Parades are happening in your area? Check out this blog below for all of the information! Collingwood Santa Claus
October 2022 Southern Georgian Bay Market Stats
VOLUME AND UNIT SALES DOWN, WITH AVERAGE SALE PRICE UP YEAR-TO-DATE SALES VOLUME OF $1,435,093,590 Down 29% from 2021’s $2,031,341,398, with units of 1462 down 37% from 2021’s 2337. New

Southern Georgian Bay Market Report – August 2022
VOLUME AND UNIT SALES DOWN, WITH AVERAGE SALE PRICES UP YEAR-TO-DATE SALES VOLUME OF $1,218,209,468 Down 25% from 2021’s $1,621,825,562, with units of 1213 down 36% from 2021’s 1898. New

Market Reports by Area 2nd Quarter 2022
Below you will find the 2022 2nd Quarter Market Reports for Blue Mountain, Clearview, Collingwood, Meaford, Owen Sound, Tiny Township and Wasaga Beach Blue Mountains Q2-2022 – The Blue Mts.
