
OVERVIEW
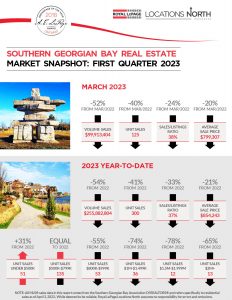
VOLUME, UNITS AND PRICES DOWN FROM LAST YEAR, WITH AVERAGE SALE TIMES UP
FIRST-QUARTER SALES VOLUME OF $255,882,804
Down 54% from Q1-2022’s $543,195,714, with units of 300 down 41% from Q1-2022’s 504. New listings of 815 up 13% from one year ago, with the sales/listings ratio of 37% down 33%.
MARCH SALES VOLUME OF $99,913,404
Down 52% from last March’s $209,717.742. March units of 125 down 40% from last year’s 210. New listings of 333 down 2% from a year ago, with the sales/listing ratio of 38% down 24%.
YEAR-TO-DATE AVERAGE SALE PRICE OF $854,243
Down 21% from the $1,077,769 of one year ago. Average days-on-market of 54 up 36 days
THE DEMAND FOR LISTINGS IS SLIGHTLY LESS THAN THE SUPPLY
The Southern Georgian Bay market had a 96.7% sale/list price ratio in March, down from last year’s 103%. Homes sold in 41 days on average, up 29 days from a year ago.
The Full Report and Snapshot are available for viewing below,
Q1 2023 Southern Georgian Bay Market Stats
Q1-2023 – Southern Georgian Bay Market Snapshot