OVERVIEW
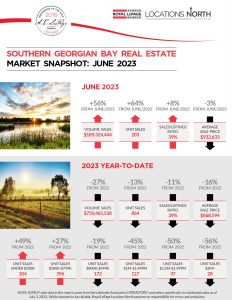
YEAR-TO-DATE SALES DOWN FROM 2022, BUT WITH SECOND QUARTER AND JUNE SALES UP
YEAR-TO-DATE SALES VOLUME OF $750,465,538
Down 27% from 2022’s $1,030,314,845, with units of 864 down 13% from 2022’s 994. New listings of 2204 up 10% from a year ago, with the sales/listings ratio of 39% down 11%.
SECOND QUARTER SALES VOLUME OF $493,297,734
Up 1% from Q2-2022’s $487,119,131. Q2-2023’s 563 units up 15% from Q2-2022’s 490. New listings of 1387 up 8% from a year ago, with the sales/listing ratio of 41% up 3%.
YEAR-TO-DATE AVERAGE SALE PRICE OF $868,594
Down 16% from last year’s $1,036,534. Average days-on-market of 40 up 23 days
FULL REPORTS HERE FOR DOWNLOAD:
Q2-2023 – Southern Georgian Bay Market Snapshot
Q2 2023 for upload Southern Georgian Bay