OVERVIEW
THIRD-QUARTER SALES UP FROM A YEAR AGO, BUT YEAR-TO-DATE SALES DOWN OVERALL
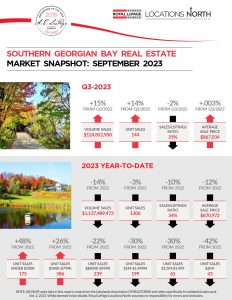
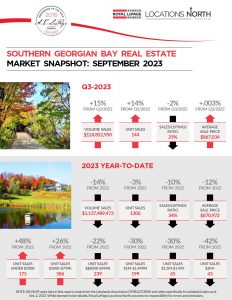
YEAR-TO-DATE SALES VOLUME OF $1,137,489,473
Down 14% from 2022’s $1,328,093,377, with units of 1306 down 3% from 2022’s 1341. New listings of 3483 up 13% from a year ago, with the sales/listings ratio of 34% down 10%.
THIRD-QUARTER SALES VOLUME OF $388,795,935
Up 31% from Q3-2022’s $297,778,532. Units of 443 up 28% from Q3-2022’s 347, with a 35% sales/listings ratio. New listings of 1271 up 18% from a year ago, with expireds of 202 up 5%.
YEAR-TO-DATE AVERAGE SALE PRICE OF $870,972
Down 12% from last year’s $990,375. Average days-on-market of 60 up 38 days.
FULL MARKET REPORTS HERE:
Q3 – 2023 Full Report Southern Georgian Bay
Q3-2023 – Southern Georgian Bay Market Snapshot
