OVERVIEW
APRIL VOLUME AND UNIT SALES THE MOST SINCE LAST MAY.
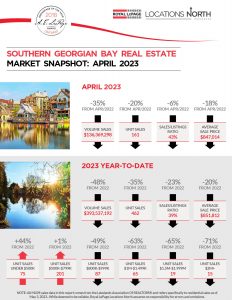
YEAR-TO-DATE SALES VOLUME OF $393,537,102
Down 48% from 2022’s $752,743,842, with units of 462 down 35% from 2022’s 706. New listings of 1191 up 5% from one year ago, with the sales/listings ratio of 39% down 23%.
APRIL SALES VOLUME OF $136,369,298
Down 35% from last April’s $209,548,128. April units of 161 down 20% from last year’s 202. New listings of 374 down 10% from a year ago, with the sales/listing ratio of 43% down 6%.
YEAR-TO-DATE AVERAGE SALE PRICE OF $851,812
Down 20% from the $1,066,209 of one year ago. Average days-on-market of 45 up 28 days
THE DEMAND FOR LISTINGS IS GREATER THAN THE SUPPLY
Homes sold in 44 days on average, up 31 days from a year ago. There is currently 4 months of inventory. All that, and April’s 43% sales/listings ratio – down from last April’s 49% – adds up to a soft sellers’ market
April -2023 – Southern Georgian Bay Market Snapshot