
OVERVIEW
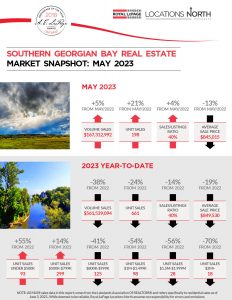
VOLUME AND UNITS UP FROM MAY 2022, WITH AVERAGE SALE PRICES DOWN.
YEAR-TO-DATE SALES VOLUME OF $561,539,094
Down 38% from 2022’s $911,553,419, with units of 661 down 24% from 2022’s 870. New listings of 1637 up 3% from one year ago, with the sales/listings ratio of 40% down 14%.
MAY SALES VOLUME OF $167,312,992
Up 5% from last May’s $158,809,577. May units of 198 up 21% from last year’s 164. New listings of 489 up 6% from a year ago, with the sales/listing ratio of 40% up 4%.
YEAR-TO-DATE AVERAGE SALE PRICE OF $849,530
Down 19% from last May’s $1,047,763. Average days-on-market of 42 up 26 days.
THE DEMAND FOR LISTINGS IS GREATER THAN THE SUPPLY
The Southern Georgian Bay market had a 97.4% sale/list price ratio in May, down from April’s 97.5% and last May’s 99.8%. Homes sold in 34 days on average, up 18 days from a year ago. There is currently 4 months of inventory. All that, and May’s 40% sales/listings ratio – up from last May’s 36% – adds up to a soft sellers’ market.
REPORTS HERE:
May 2023 Southern Georgian Bay Market Report
May-2023 – Southern Georgian Bay Market Snapshot