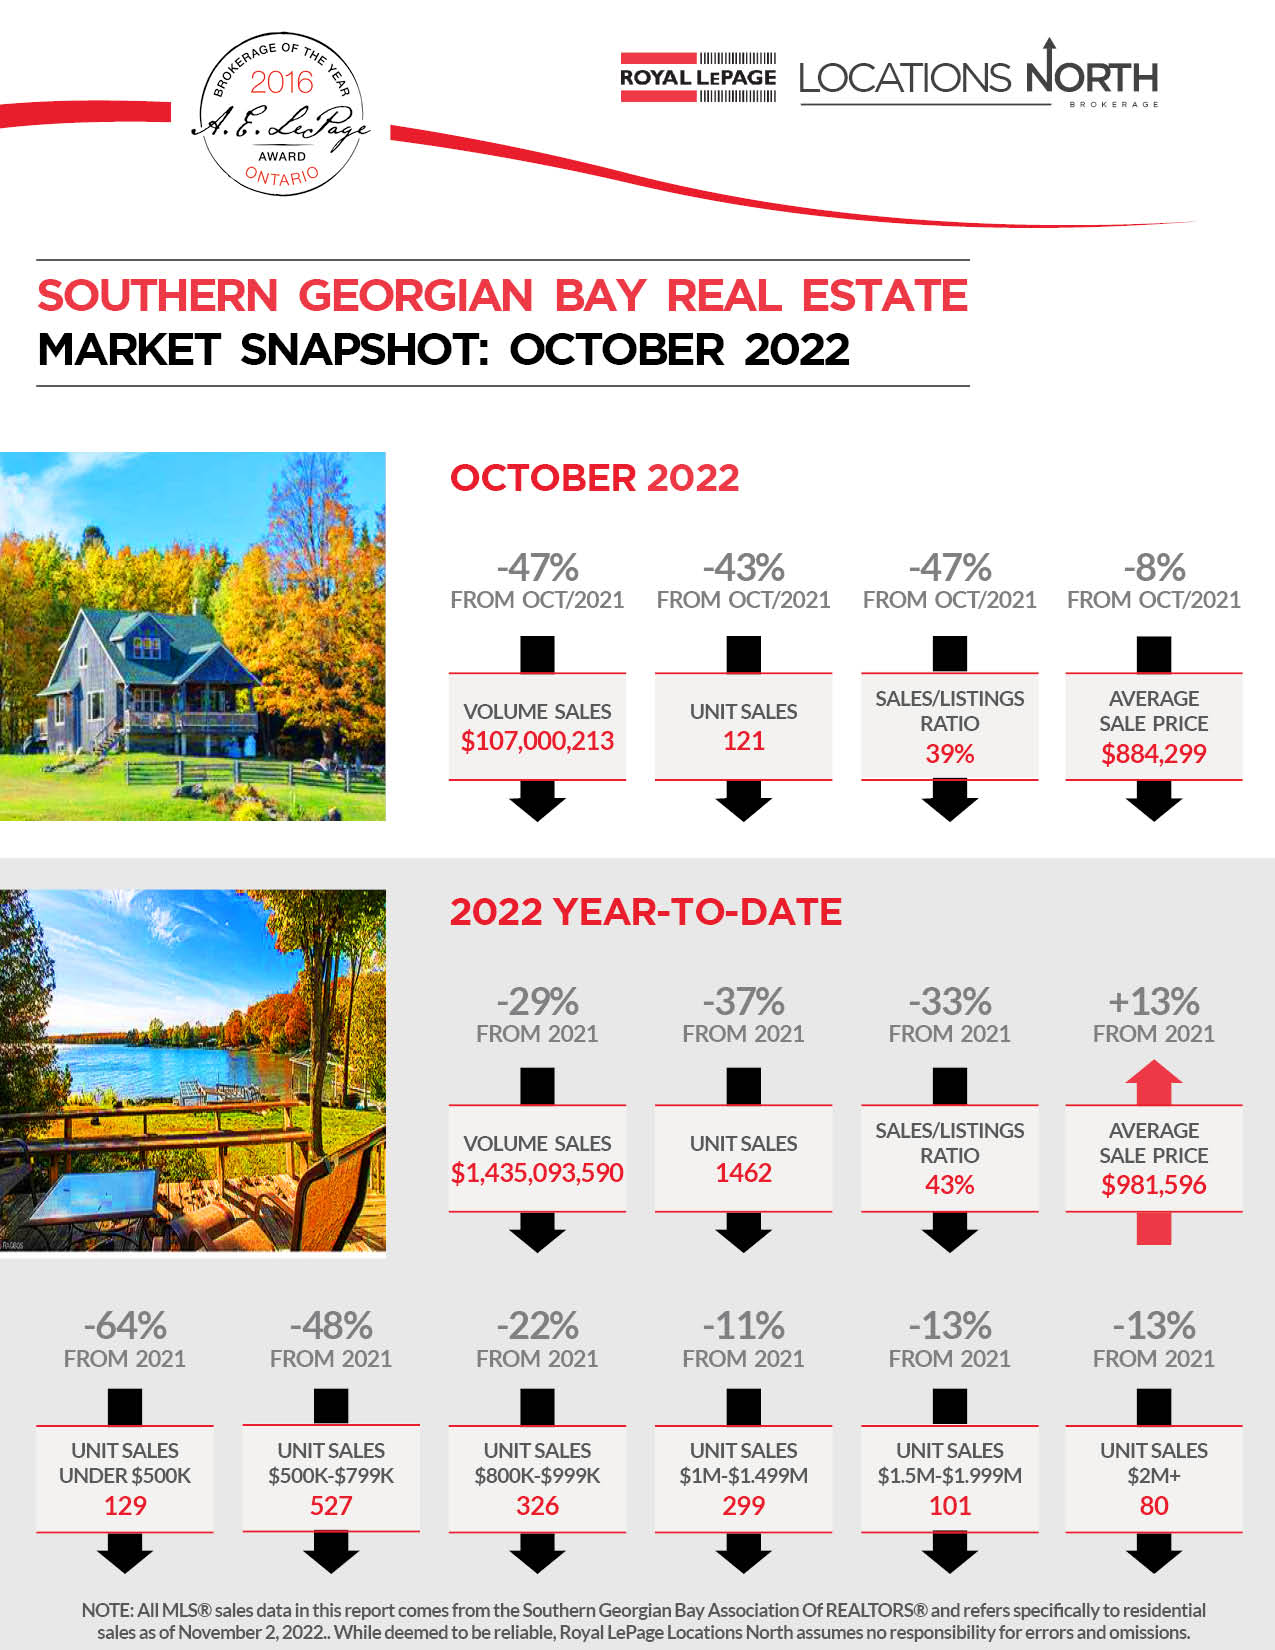

VOLUME AND UNIT SALES DOWN, WITH AVERAGE SALE PRICE UP
YEAR-TO-DATE SALES VOLUME OF $1,435,093,590
Down 29% from 2021’s $2,031,341,398, with units of 1462 down 37% from 2021’s 2337. New listings of 3398 up 11% from one year ago, with the sales/listings ratio of 43% down 33%.
OCTOBER SALES VOLUME OF $107,000,213
Down 47% from last year’s $202,102,571. October units of 121 down 43% from last year’s 211. New listings of 313 up 27% from a year ago, with the sales/listing ratio of 39% down 47%.
RECORD YEAR-TO-DATE AVERAGE SALE PRICE OF $981,596
Up 13% from last October’s $869,209. Average days-on-market of 24 up 3 from a year ago
THE DEMAND FOR LISTINGS IS LESS THAN THE SUPPLY
The Southern Georgian Bay market had a 95.8% sale/list price ratio in October. Homes sold in 45 days on average, up 18 days from a year ago, and there is now 6 months of inventory. All that, and October’s 39% sales/listings ratio, adds up to a buyers’ market which is transitioning towards balance on a year-to-date basis.
October 2022 – Southern Georgian Bay Market Snapshot
October 2022 – Southern Georgian Bay Market Report